In This Guide:
Credit
Data and Analytics - Digital Retail Services
Detailed analytics from the RouteOne Digital Retail Services can be accessed within the RouteOne system by clicking ‘Reports’ from the top navigation, and selecting ‘Digital Retail Analytics.’
You will be navigated to the ‘Digital Retail Analytics’ page. Click on the side tabs to see the detailed reports available for your online lead generation tool.
Use the date filter to view analytics during a specific date range.
To export the data shown on the page, click the ‘Download CSV’ button. To print the data shown on the page, click the ‘Print’ button.
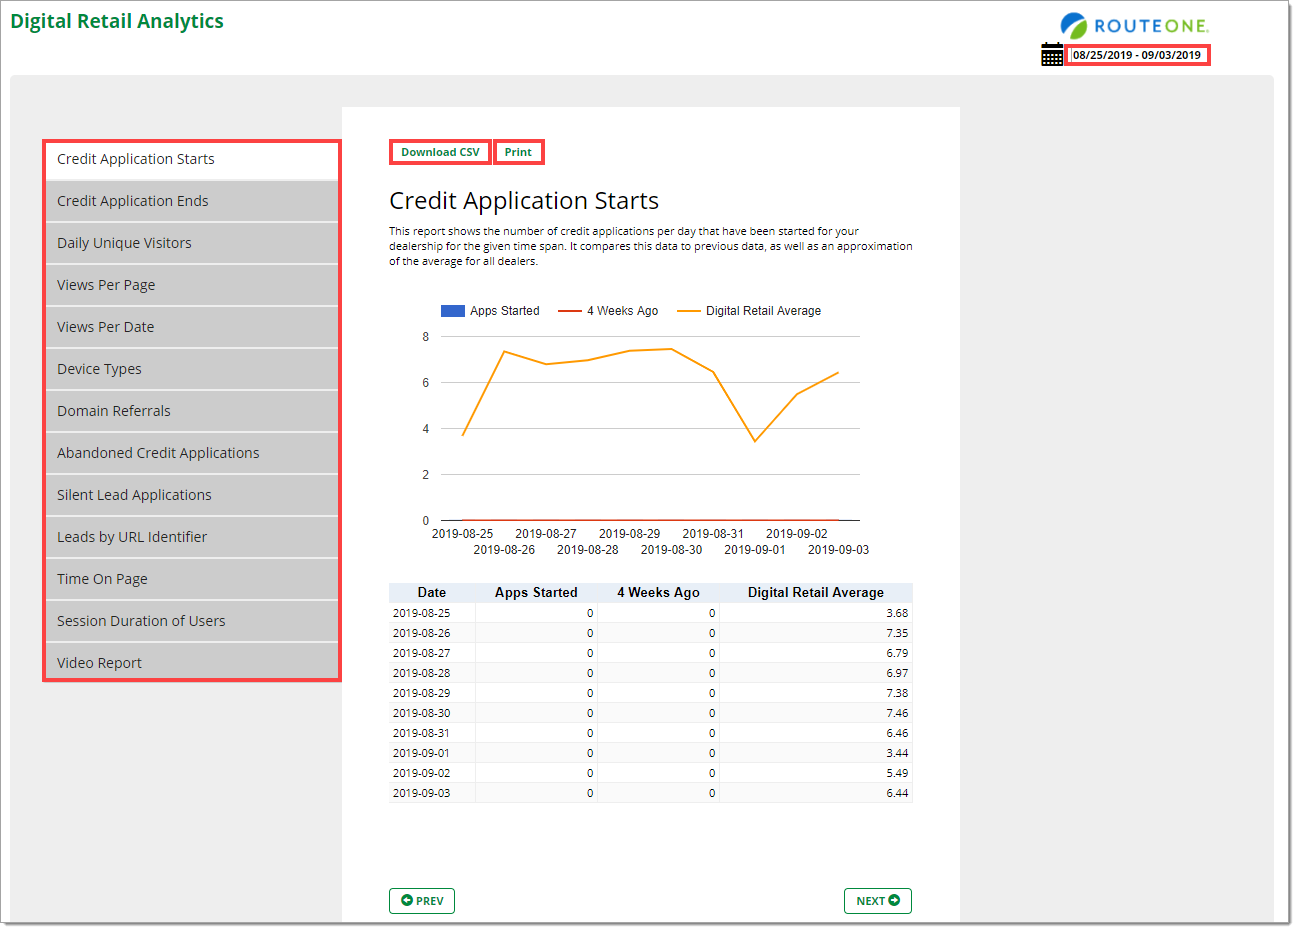
Available reports from Digital Retail Analytics
Credit Application Starts
This report shows the number of credit applications per day that have been started for your dealership for the given time span.
It compares this data to previous data, as well as an approximation of the average for all dealers.
Credit Application Ends
This report shows the number of credit applications per day that have been completed for your dealership for the given time span.
It compares this data to your previous data as well as an approximation of the average for all dealers.
Daily Unique Visitors
This report shows the number of unique users that have visited your site each day for the given time span.
It compares this data to your previous data as well as an approximation of the average for all dealers.
Views Per Page
This report shows the number of times that users have visited specific Digital Retail pages for your dealership for the given timespan.
It compares this data to an approximation of the average for all dealers.
Views Per Date
This report shows the total page views per day for your dealership for the given time span.
It compares this data to your previous data as well as an approximation of the average for all dealers.
Device Types
This report shows a breakdown of device types that users have used to access your site for a given time span.
Domain Referrals
This report shows the web page that users are coming from to your Digital Retail product during the given time span.
"Direct" means they did not get to your site by clicking on a link from another web page.
Abandoned Credit Applications
This report shows the difference between the number of credit applications that have been started and the number of credit applications that have been completed per day for your dealership for the given time span.
It compares this data to previous data, as well as an approximation of the average for all dealers.
Silent Lead Applications
This report applies only to accounts that have turned on the silent lead feature. It shows the number of silent leads per day for your dealership for the given time span.
It compares this data to your previous data as well as an approximation of the average for all dealers.
Leads by URL Identifier
This report shows how many credit applications your dealership has by your defined URL lead identifiers for a given time span.
The lead identifier "None" refers to any leads that did not have a unique identifier added by your dealership, or leads from URLs that have been deleted but are still accessible by customers.
Time On Page
This report shows the average amount of time (in seconds) that users have spent on specific Digital Retail pages for your dealership for the given time span.
It compares this data to an approximation of the average for all dealers.
Session Duration of Users
This report shows how much time users are spending on your Digital Retail site for the given time span.
It compares your data with an approximation of the average data for all dealerships.
Video Report
This report shows how many times users have started watching the video, and how many times users have watched it completely during the given time span.
It compares your data with an approximation of the average for all dealerships.
ROUTEONE SUPPORT
Hours (EST)
Monday - Friday: 6:00am – Midnight
Saturday: 9am – 9pm
Can’t find what you need?
Try our search
